Thursday, August 27, 2015

Preparing for Foreign Exchange Futures


We are going to look at futures trading currencies. We will follow 
information from Investopedia, an Internet site devoted to investing 
education based in Edmonton in Alberta, Canada.

The spot foreign exchange (forex or FX) market is the world's largest 
market, with over US$1 trillion traded per day. One derivative of this 
market is the forex futures market, which is only one one-hundredth the 
size. This article examines the key differences between forex futures and 
traditional futures and looks at some strategies for  speculating and 
hedging with this useful derivative.


Forex Futures Vs. Traditional Futures 

Both forex and traditional futures operate in the same basic manner: 
a contract is purchased to buy or sell a specific amount of an asset 
at a particular price on a predetermined date. There is, however, one 
key difference between the two: forex futures are not traded on a centralized 
exchange; rather, the deal flow is available through several different 
exchanges in the United States and abroad. The vast majority of forex futures 
are traded through the Chicago Mercantile Exchange (CME) and its 
partners (introducing brokers).

However, this is not to say that forex futures contracts are 
over-the-counter per se; the futures are still bound to a designated 
'size per contract' and are offered only in whole numbers (unlike forward contracts). 
It is important to remember that all currency futures quotes are made against the 
U.S. dollar, unlike the spot forex market.

SEE: Futures Fundamentals
Here is an example of what a forex futures quote looks like:
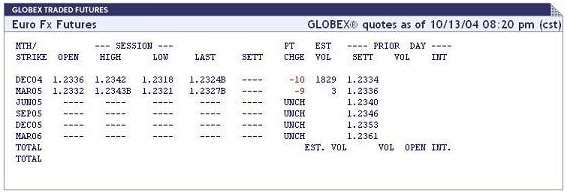
Euro FX Futures on the CME For any given futures contract, your broker should provide you with its specifications, 
such as the contract sizes, time increments, trading hours, pricing limits and other 
relevant information. Here is an example of what a specification sheet might look like:
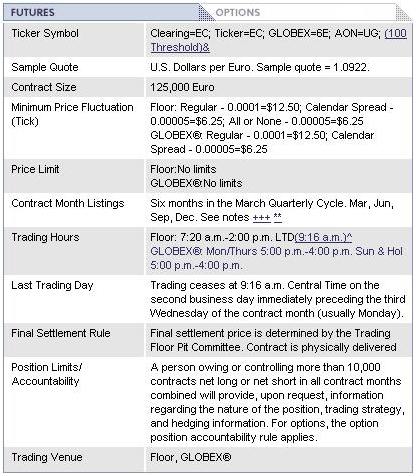
102704_2.gif
Figure 2: Specification Sheet from CME.

Hedging Vs. Speculating 

Hedging and speculating are the two primary ways in which forex derivatives are 
used. Hedgers use forex futures to reduce or eliminate risk by insulating themselves 
against any future price movements. Speculators, on the other hand, want to incur 
risk in order to make a profit. Now, let's take a more in-depth look at these two 
strategies.

Hedging 

There are many reasons to use a hedging strategy in the forex futures market. One 
main purpose is to neutralize the effect of currency fluctuations on sales revenue. 
For example, if a business operating overseas wanted to know exactly how much 
revenue it will obtain (in U.S. dollars) from its European stores, it could purchase a 
futures contract in the amount of its projected net sales to eliminate currency 
fluctuations.

SEE: Spotting A Forex Scam

When hedging, traders must often choose between futures and another derivative 
known as a forward. There are several differences between these two instruments, 
the most notable of which are these: 

• Forwards allow the trader more flexibility in choosing contract sizes and setting dates. 
This allows you to tailor the contracts to your needs instead of using a set contract 
size (futures).
• The cash that's backing a forward is not due until the expiration of the contract, 
whereas the cash behind futures is calculated daily, and the buyer and seller are 
held liable for daily cash settlements. By using futures, you have the ability to 
re-evaluate your position as often as you like. With forwards, you must wait until the 
contract expires.


Speculating 

Speculating is by nature profit-driven. In the forex market, futures and spot forex 
are not all that different. So why exactly would you want to participate in the futures 
market instead of the spot market? Well, there are several arguments for and 
against trading in the futures market:

Advantages 

• Lower spreads (two to three).
• Lower transaction costs (as low as $5 per contract).
• More leverage (often $500+ per contract).

Disadvantages 

• Often requires a higher amount of capital ($100,000 lots).
• Limited to the exchange's session times.
• National Futures Association fees may apply.

The strategies employed for speculating are similar to those used in spot markets. 
The most widely used strategies are based on common forms of technical chart 
analysis since these markets tend to trend well. These include Fibonacci studies, 
Gannstudies, pivot points and other similar techniques. Alternately, some speculators 
use more advanced strategies, such as arbitrage.

The Bottom Line

As we can see, forex futures operate similarly to traditional stock and commodity 
futures. There are many advantages to using forex futures for hedging as well as 
speculating. The distinguishing feature is that the futures are not traded on a 
centralized exchange. Forex futures can be used to hedge against currency 
fluctuations, but some traders use these instruments in pursuit of profit, just as 
they would use futures on the spot market.


$4.95 Stock Trades with TradeKing

TradeKing offers great pricing - stock trades are only $4.95/trade! Plus, their licensed 
brokers pride themselves on providing great service, short hold times, fast email 
responses and instant online chat. Click here to learn more about TradeKing!  


Follow us: @Investopedia on Twitter

Sunday, August 23, 2015

Part 6: Conclusion of our Options Sessions


This is the last of your Options Lessons. Information from all 5 of these lessions came from Investopedia Staff.

I hope this tutorial has given you some insight into the world of options. Once again, we must emphasize that options aren't for all investors. Options are sophisticated trading tools that can be dangerous if you don't educate yourself before using them. Please use this tutorial as it was intended - as a starting point to learning more about options.

Let's recap:
  1. An option is a contract giving the buyer the right but not the obligation to buy or sell an underlying asset at a specific price on or before a certain date.
  2. Options are derivatives because they derive their value from an underlying asset.
  3. A call gives the holder the right to buy an asset at a certain price within a specific period of time.
  4. A put gives the holder the right to sell an asset at a certain price within a specific period of time.
  5. There are four types of participants in options markets: buyers of calls, sellers of calls, buyers of puts, and sellers of puts.
  6. Buyers are often referred to as holders and sellers are also referred to as writers.
  7. The price at which an underlying stock can be purchased or sold is called the strike price.
  8. The total cost of an option is called the premium, which is determined by factors including the stock price, strike price and time remaining until expiration.
  9. A stock option contract represents 100 shares of the underlying stock.
  10. Investors use options both to speculate and hedge risk.
  11. Employee stock options are different from listed options because they are a contract between the company and the holder. (Employee stock options do not involve any third parties.)
  12. The two main classifications of options are American and European.

  • Long term options are known as LEAPS.

Sunday, August 16, 2015

Part 5:How To Read An Options Table

occupy wall street march 17, 2012

As usual on Options education, we will use  information from the Investopedia Staff.

As more and more traders have learned of the multitude of potential benefits available to them via the use of options, the trading volume in options has proliferated over the years. This trend has also been driven by the advent of electronic trading and data dissemination. Some traders use options to speculate on price direction, others tohedge existing or anticipated positions and others still to craft unique positions that offer benefits not routinely available to the trader of just the underlying stock, index or futures contract (for example, the ability to make money if the underlying security remains relatively unchanged). Regardless of their objective, one of the keys to success is to pick the right option, or combination of options, needed to create a position with the desired risk-to-reward tradeoff(s). As such, today's savvy option trader is typically looking at a more sophisticated set of data when it comes to options than the traders of decades past.

The Old Days of Option Price Reporting

In "the old days" some newspapers used to list rows and rows of nearly indecipherable option price data deep within its financial section such as that displayed in Figure 1.

 
Figure 1: Option data from
a newspaper
Investor's Business Daily and the Wall Street Journal still include a partial listing of option data for many of the more active optionable stocks. The old newspaper listings included mostly just the basics – a "P" or a "C" to indicate if the option a call or a put, the strike price, the last trade price for the option, and in some cases, volume and open interest figures. And while this was all well and good, many of today's option traders have a greater understanding of the variables that drive option trades. Among these variables are a number of "Greek" values derived from an option pricing model, implied option volatility and the all important bid/ask spread. (Learn more in Using the Greeks to Understand Options.)

Trading Desk
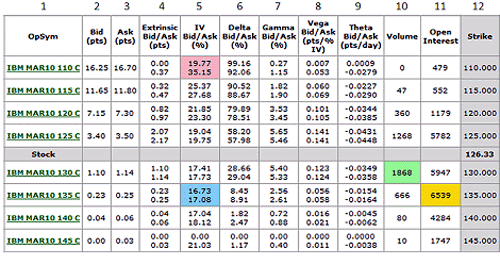
As a result, more and more traders are finding option data via on-line sources. While each source has its own format for presenting the data, the key variables generally include those listed in Figure 2. The option listing shown in Figure 2 is from Optionetics Platinum software. The variables listed are the ones most looked at by today's better educated option trader.
 
Figure 2: March call options for IBM

The data provided in Figure 2 provides the following information:

Column 1 – OpSym: this field designates the underlying stock symbol (IBM), the contract month and year (MAR10 means March of 2010), the strike price (110, 115, 120, etc.) and whether it is a call or a put option (a C or a P).

Column 2 – Bid (pts): The "bid" price is the latest price offered by a market maker to buy a particular option. What this means is that if you enter a "market order" to sell the March 2010, 125 call, you would sell it at the bid price of $3.40. 

Column 3 – Ask (pts): The "ask" price is the latest price offered by a market maker to sell a particular option. What this means is that if you enter a "market order" to buy the March 2010, 125 call, you would buy it at the ask price of $3.50.

NOTE: Buying at the bid and selling at the ask is how market makers make their living. It is imperative for an option trader to consider the difference between the bid and ask price when considering any option trade. The more active the option, typically the tighter the bid/ask spread. A wide spread can be problematic for any trader, especially a short-term trader. If the bid is $3.40 and the ask is $3.50, the implication is that if you bought the option one moment (at $3.50 ask) and turned around and sold it an instant later (at $3.40 bid), even though the price of the option did not change, you would lose -2.85% on the trade ((3.40-3.50)/3.50). 

Column 4 – Extrinsic Bid/Ask (pts): This column displays the amount of time premium built into the price of each option (in this example there are two prices, one based on the bid price and the other on the ask price). This is important to note because all options lose all of their time premium by the time of option expiration. So this value reflects the entire amount of time premium presently built into the price of the option.


Column 5 – Implied Volatility (IV) Bid/Ask (%): This value is calculated by an option pricing model such as the Black-Scholes model, and represents the level of expected future volatility based on the current price of the option and other known option pricing variables (including the amount of time until expiration, the difference between the strike price and the actual stock price and a risk-free interest rate). The higher the IV Bid/Ask (%)the more time premium is built into the price of the option and vice versa. If you have access to the historical range of IV values for the security in question you can determine if the current level of extrinsic value is presently on the high end (good for writing options) or low end (good for buying options).

Column 6 – Delta Bid/Ask (%): Delta is a Greek value derived from an option pricing model and which represents the "stock equivalent position" for an option. The delta for a call option can range from 0 to 100 (and for a put option from 0 to -100). The present reward/risk characteristics associated with holding a call option with a delta of 50 is essentially the same as holding 50 shares of stock. If the stock goes up one full point, the option will gain roughly one half a point. The further an option is in-the-money, the more the position acts like a stock position. In other words, as delta approaches 100 the option trades more and more like the underlying stock i.e., an option with a delta of 100 would gain or lose one full point for each one dollar gain or loss in the underlying stock price. (For more check out Using the Greeks to Understand Options.)

Column 7 – Gamma Bid/Ask (%): Gamma is another Greek value derived from an option pricing model. Gamma tells you how many deltas the option will gain or lose if the underlying stock rises by one full point. So for example, if we bought the March 2010 125 call at $3.50, we would have a delta of 58.20. In other words, if IBM stock rises by a dollar this option should gain roughly $0.5820 in value. In addition, if the stock rises in price today by one full point this option will gain 5.65 deltas (the current gamma value) and would then have a delta of 63.85. From there another one point gain in the price of the stock would result in a price gain for the option of roughly $0.6385.

Column 8 – Vega Bid/Ask (pts/% IV): Vega is a Greek value that indicates the amount by which the price of the option would be expected to rise or fall based solely on a one point increase in implied volatility. So looking once again at the March 2010 125 call, if implied volatility rose one point – from 19.04% to 20.04%, the price of this option would gain $0.141. This indicates why it is preferable to buy options when implied volatility is low (you pay relatively less time premium and a subsequent rise in IV will inflate the price of the option) and to write options when implied volatility is high (as more premium is available and a subsequent decline in IV will deflate the price of the option).

Column 9 – Theta Bid/Ask (pts/day): As was noted in the extrinsic value column, all options lose all time premium by expiration. In addition, "time decay" as it is known, accelerates as expiration draws closer. Theta is the Greek value that indicates how much value an option will lose with the passage of one day's time. At present, the March 2010 125 Call will lose $0.0431 of value due solely to the passage of one day's time, even if the option and all other Greek values are otherwise unchanged. 

Column 10 – Volume: This simply tells you how many contracts of a particular option were traded during the latest session. Typically – though not always - options with large volume will have relatively tighter bid/ask spreads as the competition to buy and sell these options is great.

Column 11 – Open Interest: This value indicates the total number of contracts of a particular option that have been opened but have not yet been offset.

Column 12 – Strike: The "strike price" for the option in question. This is the price that the buyer of that option can purchase the underlying security at if he chooses to exercise his option. It is also the price at which the writer of the option must sell the underlying security if the option is exercised against him.

A table for the respective put options would similar, with two primary differences:
 

  • Call options are more expensive the lower the strike price, put options are more expensive the higher the strike price. With calls, the lower strike prices have the highest option prices, with option prices declining at each higher strike level. This is because each successive strike price is either less in-the-money or more out-of-the-money, thus each contains less "intrinsic value" than the option at the next lower strike price. With puts, it is just the opposite. 


  • As the strike prices go higher, put options become either less-out-of-the-money or more in-the-money and thus accrete more intrinsic value. Thus with puts the option prices are greater as the strike prices rise. For call options, the delta values are positive and are higher at lower strike price. For put options, the delta values are negative and are higher at higher strike price. The negative values for put options derive from the fact that they represent a stock equivalent position. Buying a put option is similar to entering a short position in a stock, hence the negative delta value.


Option trading and the sophistication level of the average option trader have come a long way since option trading began decades ago. Today's option quote screen reflects these advances. 

Click on the link below. 
 

Get a free book on Options Trading click the link above.

Monday, August 10, 2015

Part 4: How Options Work


We are going to learn how Options work by reading information 

created by Investopedia Staff.


Now that you know the basics of options, here is an example of 

how they work. We'll use a fictional firm called Cory's Tequila 

Company. Let's say that on May 1, the stock price of Cory's 

Tequila Co. is $67 and the premium (cost) is $3.15 for a July 70 

Call, which indicates that the expiration is the third Friday of July 

and the strike price is $70. The total price of the contract 

is $3.15 x 100 = $315. In reality, you'd also have to take 

commissions into account, but we'll ignore them for this example.


Remember, a stock option contract is the option to buy 100 shares;


that's why you must multiply the contract by 100 to get the total 

price. The strike price of $70 means that the stock price must rise

above $70 before the call option is worth anything; furthermore,

because the contract is $3.15 per share, the break-even price would 

be $73.15.


When the stock price is $67, it's less than the $70 strike price, so


the option is worthless. But don't forget that you've paid $315 for 

the option, so you are currently down by this amount.


Three weeks later the stock price is $78. The options contract has


increased along with the stock price and is now worth $8.25 x 100

 = $825. Subtract what you paid for the contract, and your profit is 

($8.25 - $3.15) x 100 = $510. You almost doubled our money in

 just three weeks! You could sell your options, which is 

called "closing your position," and take your profits - unless, of

 course, you think the stock price will continue to rise. For the sake

 of this example, let's say we let it ride.


By the expiration date, the price drops to $62. Because this is less


than our $70 strike price and there is no time left, the option

contract is worthless. We are now down to the original investment

of $315.

To recap, here is what happened to our option investment:


Date 1-May 21-May   Expiry Date
Stock Price $67 $78 $62
Option Price $3.15 $8.25    worthless
Contract Value $315 $825 $0
Paper Gain/Loss $0 $510 ($315)

would have given us over double our original investment. This is

leverage in action. The price swing for the length of this contract

from high to low was $825, which 

Image result for pictures of options trading building


would have given us over double our original investment. 

This is leverage in action.


Exercising Versus Trading-Out

So far we've talked about options as the right to buy or sell 

(exercise) the underlying. This is true, but in reality, a 

majority of options are not actually exercised.


 In our example, you could make money by exercising at $70 


and then selling the stock In our example, you could make money 

by  back in the market at $78 for a profit of $8 a share. You could

also keep the stock, knowing you were able to buy it at a discount 

to the present value.


However, the majority of the time holders choose to take their


profits by trading out (closing out) their position. This means that 

holders sell their options in the market, and writers buy their

positions back to close. According to the CBOE, about 10% 

of options are exercised, 60% are traded out, and 30% expire

worthless.


Intrinsic Value and Time Value

At this point it is worth explaining more about the pricing of 


options. In our example the premium (price) of the option went 

from $3.15 to $8.25. These fluctuations can be explained by

intrinsic value and time value.


Basically, an option's premium is its intrinsic value + time value.


Remember, intrinsic value is the amount in-the-money, which,

for a call option, means that the price of the stock equals the strike

price. Time value represents the possibility of the option
increasing in value. So, the price of the option in our example can

be thought of as the following:


$8.25 =
$8+$0.25

In real life options almost always trade above intrinsic value. 

If you are wondering, we just picked the numbers for this 

example out of the air to demonstrate how options work.


Here are some questions:

1. This XYZ Option contract sells for  $3.15 meaning that the speculator controls 100 shares of XYZ stock totaling $315.  

(True or False)

2.  intrinsic value is the amount in-the-money, which, 

for a call option, means that the price of the stock equals
the strike price. (True or False)


According to the CBOE, about 3._____ 
of options are exercised, 4._______are traded out, and 
5.______expire worthless.

Look up your answers.

If you got none wrong, you may have a future in Options.
If you have 1 wrong, review this blog on Options.
If you have 2 or more wrong, use an Options broker to work 
your trades.